
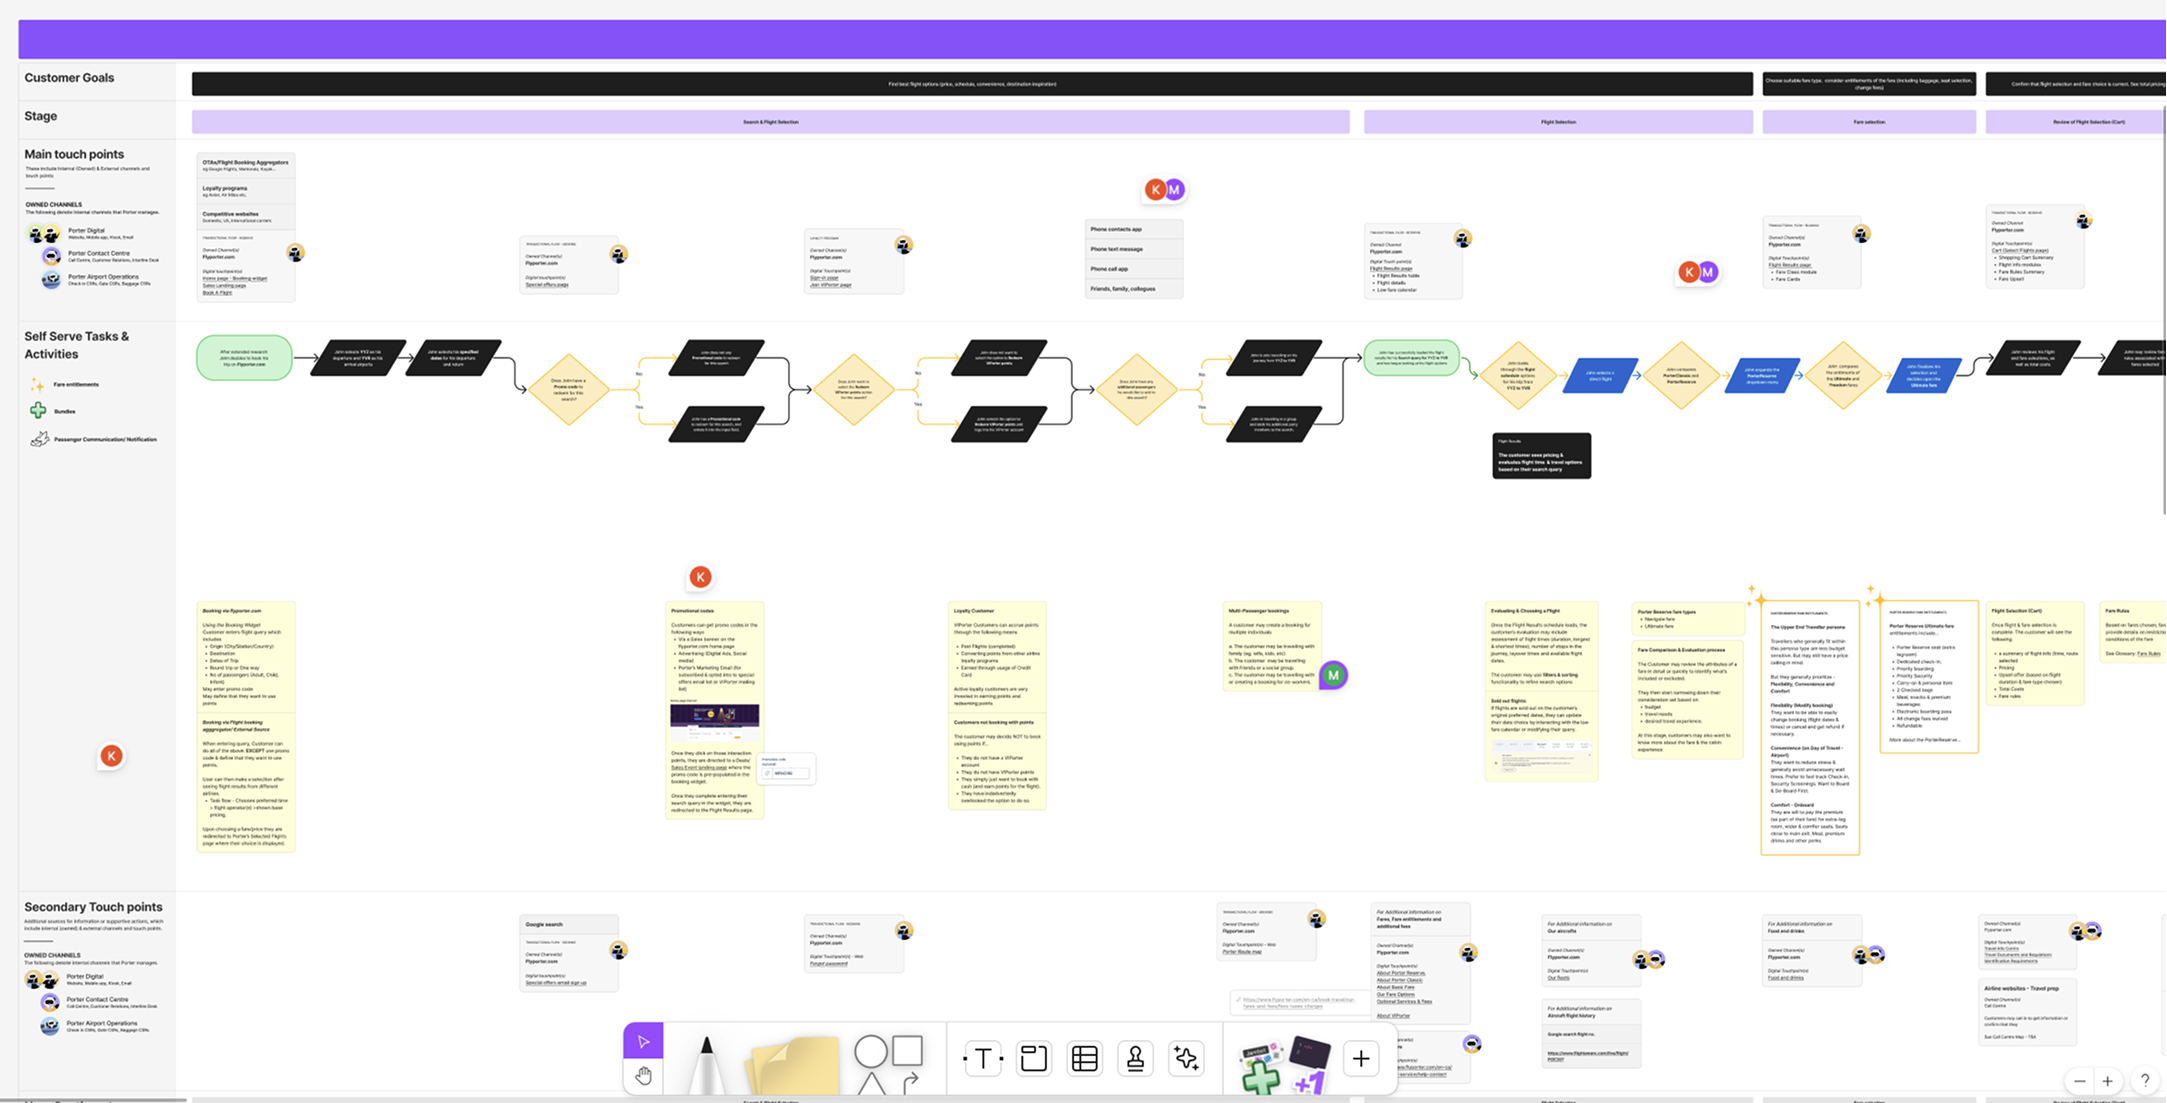
In the airline industry, it's pretty common for departments to have a fragmented view of the whole customer experience. At Porter, Airport operations, Contact Center, Revenue, Digital, Technology, and Marketing each held a partial view, shaped by the touchpoints they owned. That made it hard to fully understand the traveler's struggles, from exploration to post travel. Pain points lived in separate places: some in call center data, some in the digital solutions team, some only in the heads of frontline staff.
Project that gave six departments their first shared, evidence-based view of the traveler, spanning the full travel lifecycle including disruptions and baggage. Some content has been simplified or anonymized to respect confidentiality.
CJM Team: UX Designers: Virna Varela, Matt Tran, Manali Desai | UX Researcher: Chanile Vine | Design Lead: Kezia Payne
Timeline: 5 months (2025)
Tools: Figma, FigJam
Departments involved: Airport Operations, Contact Centre, Revenue Management, Digital, Technology, Marketing, Operational Excellence
Create a comprehensive journey map that would:

The 10-phase lifecycle diagram (Pre-booking → Post travel)
We interviewed stakeholders across six departments to understand each team's view of the traveler, the constraints they operate within, and the friction they see firsthand. We also spent time in airport environments, observing operations and shadowing staff, to understand the challenges frontline teams face and how large and small airports differ in practice.
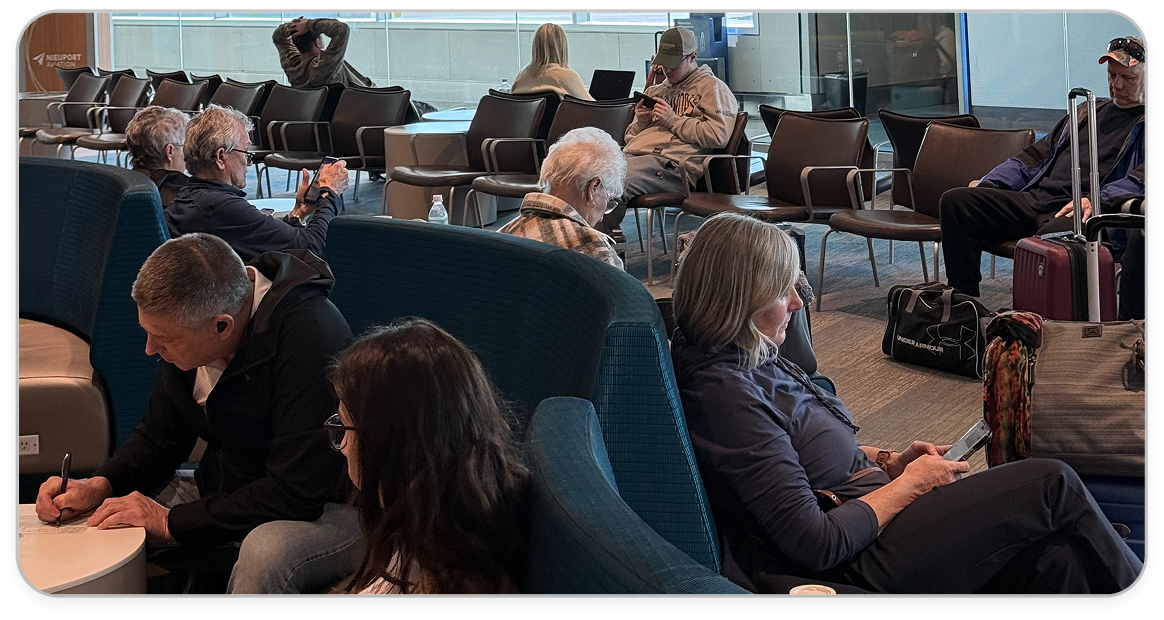
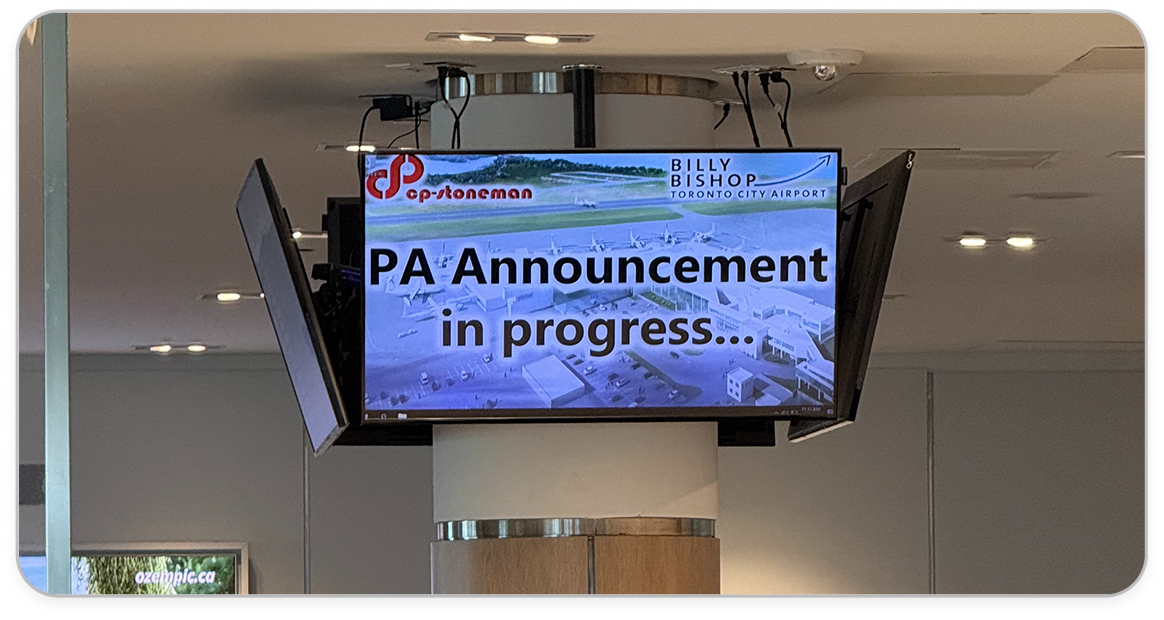

We combined this with customer data, CSAT, conjoint analysis, and Voice of the Customer feedback, to assess the struggles customers were actually reporting and separate the factual from the anecdotal.
Each map documented customer goals, touchpoints, self-serve tasks, emotions, pain points, technical limitations, and opportunities.
This is the moment travelers most need real-time information, but the sources they rely on aren't always consistent. Gate screens, the app, and announcements can each say something different.
"The information provided at the gate was not consistent with the information on the app or the Porter website."
In unfamiliar airports, connections, and ground transportation, travelers have the least guidance, and in-person help is often unavailable.
"I needed to print my boarding pass at the airport, but there was no one at the desk. I didn't know what to do."
Proactive updates aren't always consistent, especially after a rebooking, and travelers don't always know what options are available to them.
Without real-time tracking, travelers are left guessing, and clearer guidance at connections would ease a lot of that uncertainty.
"I wasn't aware that I needed to recheck my bag at my connection, and now it's lost."
The experience depends on what the contact center, airport operations, and flight operations can see and do. Digital and operational channels work best when they reinforce each other.
The findings translated into opportunity themes the organization could act on:

The map became an essential reference point for the traveler across the business:
The map itself is only a tool. A journey map has no value sitting in a Figma file, its value depends entirely on whether teams adopt it and fold it into how they work. Planning for that adoption, making the work shareable, relevant, and consumable for each department, matters just as much as the research behind it. That's the part that turns insight into change.


